Fits a zero-inflated Tweedie model (via glmmTMB::glmmTMB()) with separate
count and zero-inflation components. Returns coefficients on the response
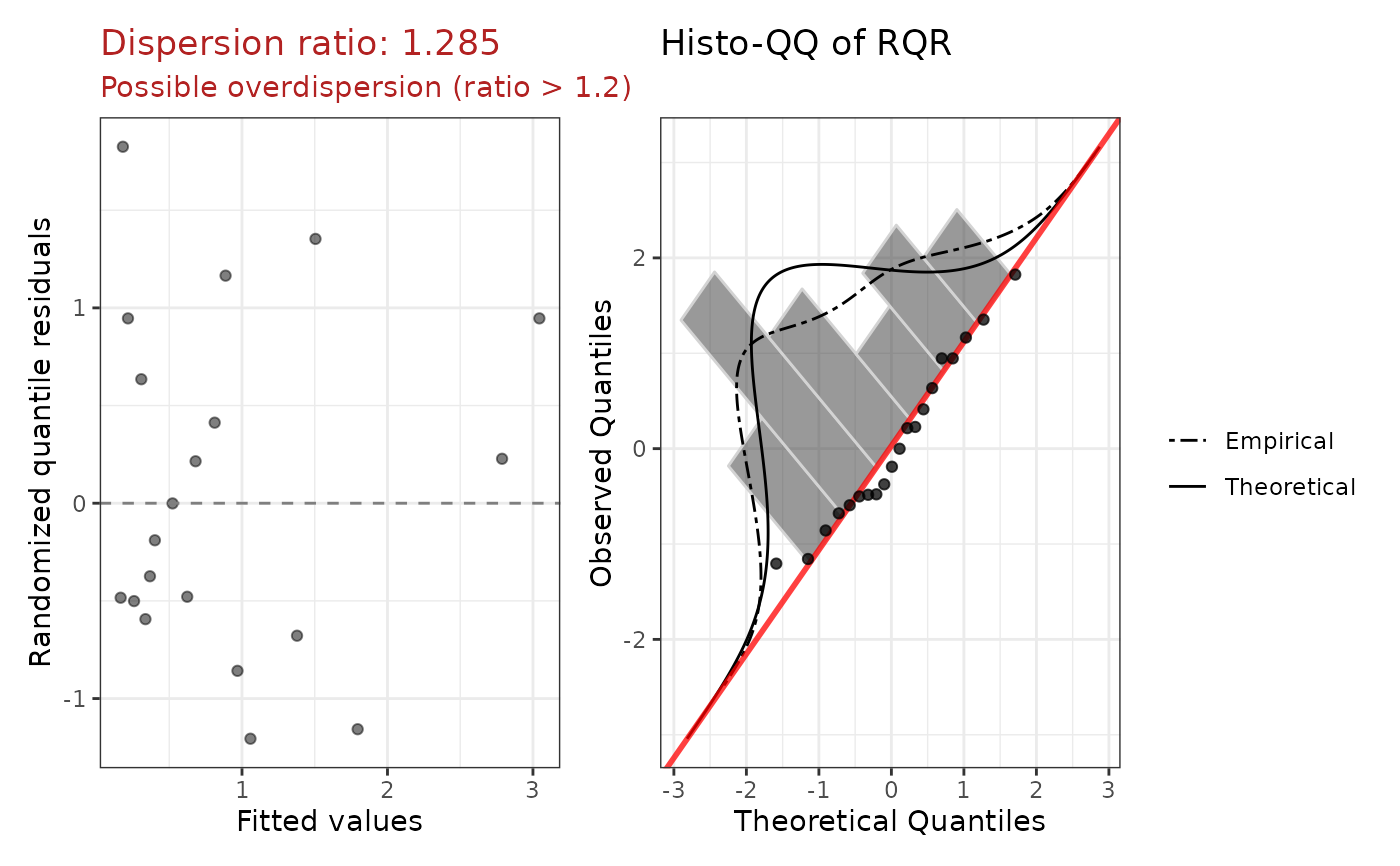
scale, randomized quantile residuals, dispersion (phi) and power (p)
parameters, and diagnostic plots.
Usage
zeroinflTweedieGLM(
  formula,
  data,
  ziformula = NULL,
  maxit = NULL,
  dispersion_threshold = 1.2,
  ...
)
Arguments
- formula
A model formula for the count component (e.g.
y ~ x1 + x2). The response must be non-negative.- data
A data frame containing the variables in
formula(andziformulaif provided).- ziformula
A one-sided formula for the zero-inflation component (e.g.
~ x1). WhenNULL(default), the same right-hand side asformulais used for both components. Use~ 1for an intercept-only zero-inflation model.- maxit
Optional integer; maximum optimizer iterations passed through as
control = glmmTMB::glmmTMBControl(optCtrl = list(iter.max = maxit, eval.max = maxit)). Ignored when the user supplies their owncontrolvia....- dispersion_threshold
Numeric; dispersion ratios above this value are flagged as overdispersed in the diagnostic plot. Default 1.2.
- ...
Additional arguments passed to
glmmTMB::glmmTMB().
Value
An object of class c("zeroinflTweedieGLM", "zeroinflGLMfit", "countGLMfit"), a list with:
callThe matched call.
modelThe underlying glmmTMB::glmmTMB fit object.
summaryThe result of
summary()on the fitted model.phiThe estimated Tweedie dispersion parameter (phi).
pThe estimated Tweedie power parameter (p), in (1, 2).
NAif the parameter cannot be extracted from the fit.coefficientsA list with two data frames, each with columns
term,exp.coef,lower.95,upper.95,p.value, andstars:countExponentiated coefficients for the count component.
zeroExponentiated coefficients for the zero-inflation component (odds ratios for structural-zero membership).
diagnosticsA list with
rqr,dispersion_ratio,plot, andr2_plot(seetweedieGLM()for details). Nozi_testis included since this model already accounts for zero-inflation.aicAIC of the fitted model.
bicBIC of the fitted model.
Details
Coefficient interpretation:
Count component: exponentiating a coefficient gives the multiplicative change in the expected Tweedie mean among observations that are not structural zeros, for a one-unit increase in the predictor.
Zero component: exponentiating a coefficient gives the multiplicative change in the odds of being a structural zero (vs. entering the count process) for a one-unit increase in the predictor. A value greater than 1 means higher odds of a structural zero.
When to use: Zero-inflated Tweedie is the most flexible model in glmOJ.
It handles excess zeros and complex variance structures simultaneously.
Prefer this over zeroinflPoissonGLM() or zeroinflNegbinGLM() when count
data show overdispersion and excess zeros that neither of those families
adequately captures. When using countGLM(), this model is fitted only
when the DHARMa zero-inflation test flags the base Tweedie fit
(p < 0.05).
Examples
df <- data.frame(
  y  = c(0, 0, 0, 1.5, 3.2, 0, 0.9, 0, 0, 2.7,
         0, 0, 4.1, 0, 1.2, 0, 0, 5.8, 0, 0),
  x1 = c(1.2, -0.4, 0.8, -1.1, 2.0, 0.3, -0.9, 1.5, -0.2, 0.7,
         -0.5, 0.9, 1.3, -0.3, 0.6, -1.2, 0.1, 2.1, -0.7, 0.4)
)
fit <- suppressWarnings(zeroinflTweedieGLM(y ~ x1, data = df))
print(fit)
#>
#> Call:
#> zeroinflTweedieGLM(formula = y ~ x1, data = df)
#>
#> Model family: zeroinflTweedieGLM
#>
#> Count component (exponentiated coefficients):
#>         term exp.coef lower.95 upper.95 p.value stars
#>  (Intercept)   0.7391   0.1812   3.0144  0.6733
#>           x1   2.3596   1.1133   5.0011  0.0251     *
#>
#> Zero-inflation component (exponentiated coefficients):
#>         term exp.coef lower.95 upper.95 p.value stars
#>  (Intercept)   0.5444   0.0309   9.5888  0.6778
#>           x1   0.9352   0.2112   4.1411  0.9297
#>
#> Dispersion (phi): 1.3833
#> Power (p): 1.0360
#> Dispersion ratio: 1.2846
#> AIC: 53.06
plot(fit)


# Intercept-only zero component:
fit2 <- suppressWarnings(
  zeroinflTweedieGLM(y ~ x1, data = df, ziformula = ~ 1)
)
# Intercept-only zero component:
fit2 <- suppressWarnings(
zeroinflTweedieGLM(y ~ x1, data = df, ziformula = ~ 1)
)